
Figure 1.
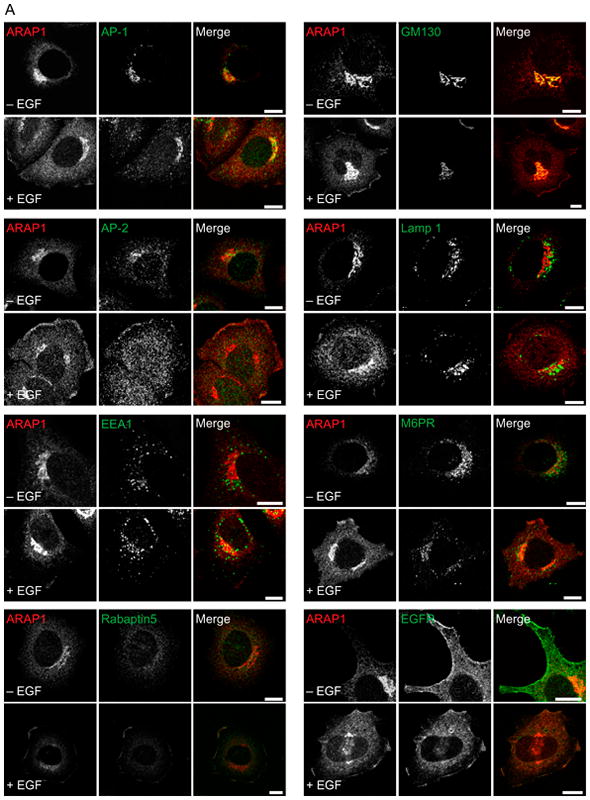
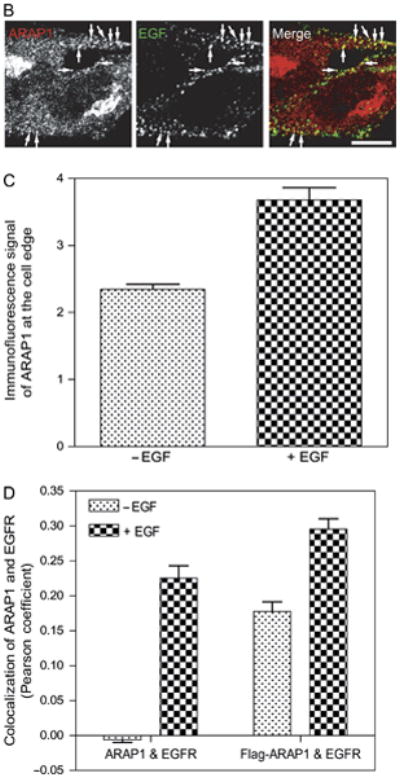
Effect of EGF on the localization of ARAP1 in HeLa cells. A) Localization of endogenous ARAP1. After 6 h of serum deprivation, HeLa cells were treated with 100 ng/mL of EGF for 5 min at 37°C. Cells were fixed, and the localization of endogenous ARAP1 and AP-1, AP-2, EEA1, EGFR, GM130, Lamp 1, M6PR or Rabaptin5 was analyzed by immunofluorescence microscopy. Scale bar, 10 μm. B) Relative localization of endogenous ARAP1 and EGF. Serum-starved HeLa cells were treated with fluorescent EGF for 5 min before fixing and staining for ARAP1. ARAP1 and EGF were visualized using confocal microscopy. Scale bar, 10 μm. Arrows indicate colocalization of ARAP1 and EGF. C) ARAP1 at the cell edge. HeLa cells were serum-starved for 6 h and then treated with 100 ng/mL EGF for 5 min. The cells were fixed and stained for ARAP1. The intensity of ARAP1 in a masked area that included the cell edge was quantified using IPLab image processing software. The data shown are for 25 cells under each condition. The error bars are the SEM. D) Colocalization of ARAP1 with EGFR. HeLa cells, expressing recombinant Flag-ARAP1, where indicated and treated with or without 100 ng/mL EGF for 5 min. The cells were fixed and stained for ARAP1 and EGFR. Images of the cells were captured using confocal microscopy. Pearson coefficients were determined for 25 cells under each condition using Zeiss lsm5 image program. The error bars are the SEM.