
Figure 2.
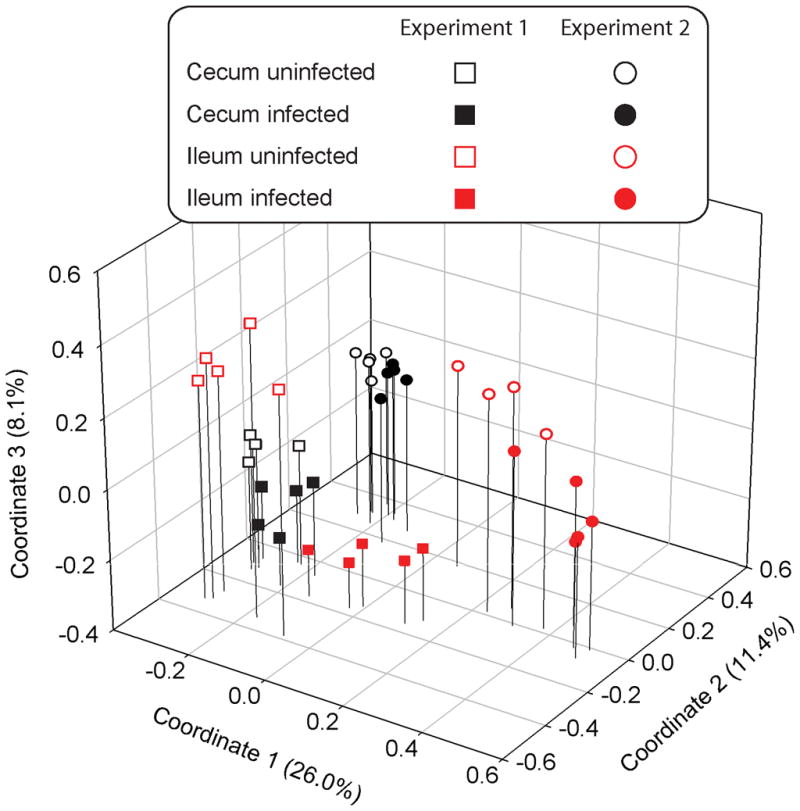
Principal coordinates analysis of the structure of the GI tract microbiotas of H. polygyrus infected and uninfected mice. Cecal and ileal microbiotas are represented by symbols of different color (cecum = black, ileum = red); experiment 1 and 2 are represented by symbols of different shape (square = experiment 1, circle = experiment 2); and microbiotas from infected and uninfected mice are represented by filled and unfilled symbols (uninfected = unfilled, infected = filled). Cecal microbiotas grouped according to the experiments. Ileal microbiotas from infected mice were different from uninfected mice in both experiments.