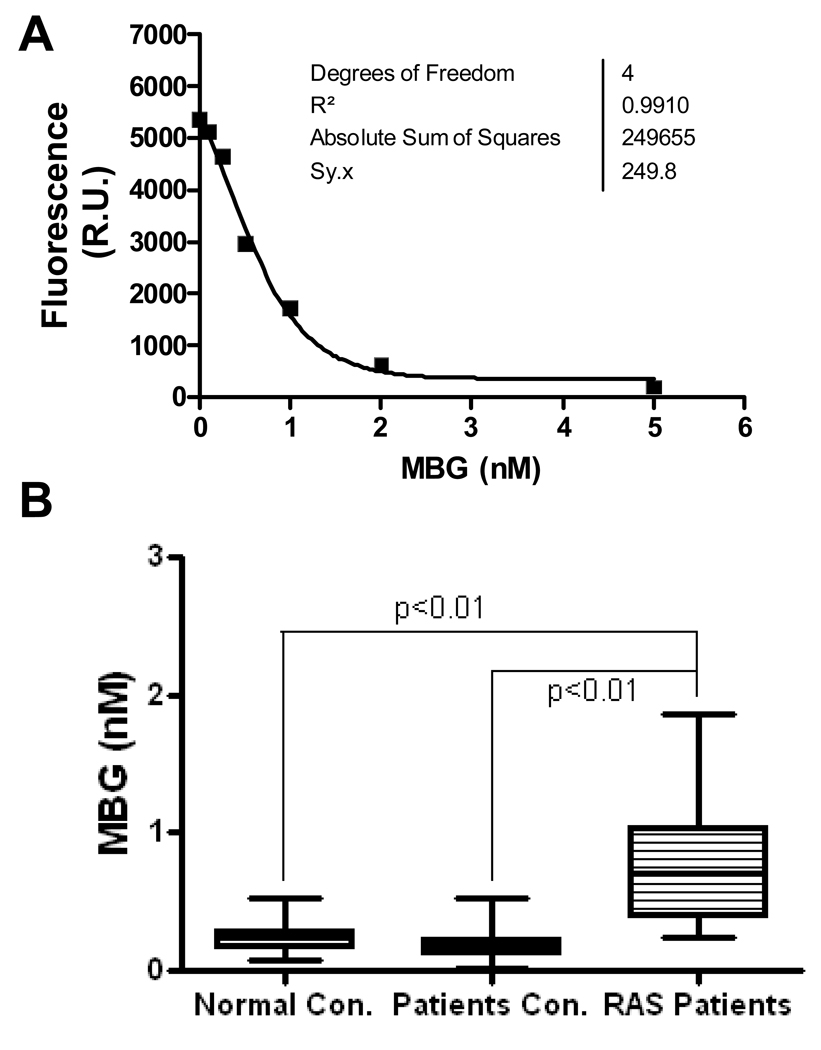
Figure 1.
Plasma Marinobufagenin (MBG) levels in RAS patients and control subjects. The MBG concentration was measured in plasma samples from RAS patients or control subjects as described in the Methods section. Panel A shows a representative standard curve of MBG measurement using purified MBG compound; Panel B shows the distribution and mean MBG levels in normal healthy controls (Normal con.), hypertensive patient controls (Patients con.), and patients with renal artery stenosis (RAS patients).

