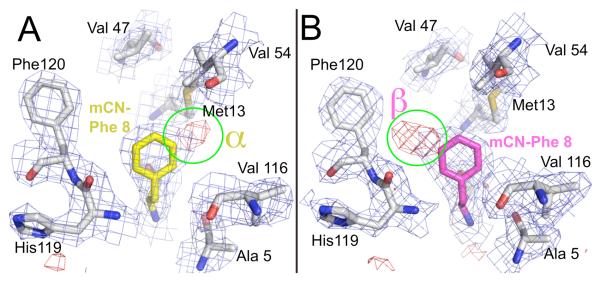
Figure 2.
Electron density maps for mCN-RNase. (A) and (B) correspond to the chain names for the two monomers in the asymmetric unit in the PDB file. The experimental electron density map represented with wire mesh (2Fobs-Fcalc contoured at 1 sigma in blue mesh, 1Fobs-Fcalc contoured at 3 sigma in red mesh) for a model with the mCN-Phe residue modeled as Phe, showing missing density for the nitrile (see text). The names α and β are given to the conformer with the nitrile nearest Met13 and Phe120, respectively. (Two foreground residues removed from view for clarity).

