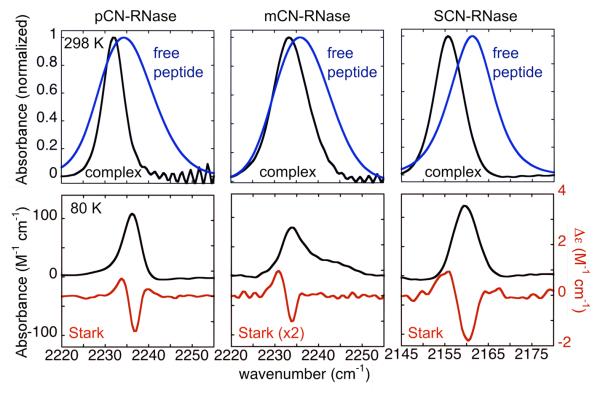
Figure 3.
FT-IR spectra of nitrile-modified RNase S and S-peptide. Top: normalized spectra of nitrile-modified S-peptide, free (blue) and bound to S-protein to form the RNase S complex (black) in 50% (vol/vol) glycerol in water, pH 7, 298 K. Bottom: Absorption spectra of the same set of RNase S complexes as above, taken at 80 K in black (left axis), and Stark spectra scaled to an applied field of 1 MV/cm in red (right axis), see Table 3.

