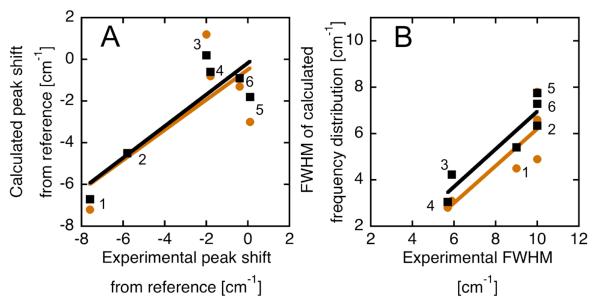
Figure 5.
Comparison between measured and simulated frequency shifts and distributions for CN-modified RNase variants. (A) Measured shifts in the peak frequency for SCN-, mCN- and pCN-RNase at pH 4.5 and pH 8.0 vs. the peak of the distribution of frequencies from 3 ns of MD (orange circles) or 3 ns of REMD (black squares) calculated for these same six cases with a post-processing dielectric of 2 (see text); experimental and simulated shifts are calculated relative to the value for EtSCN, m-tolunitrile or p-tolunitrile in n-hexane respectively (see text). Numbering as follows (pH 4.5 and pH 8.0, respectively): SCN = 1, 2; pCN = 3, 4; mCN = 6, 5. Best-fit lines: slope = 0.76 or 0.72; R2 = 0.77 or 0.57 for REMD and MD respectively. (B) Widths of calculated frequency distributions versus experimental FWHM. Best-fit lines: slope = 0.81 or 0.80; R2 = 0.87 or 0.73 for REMD and MD respectively.

