
Figure 4.
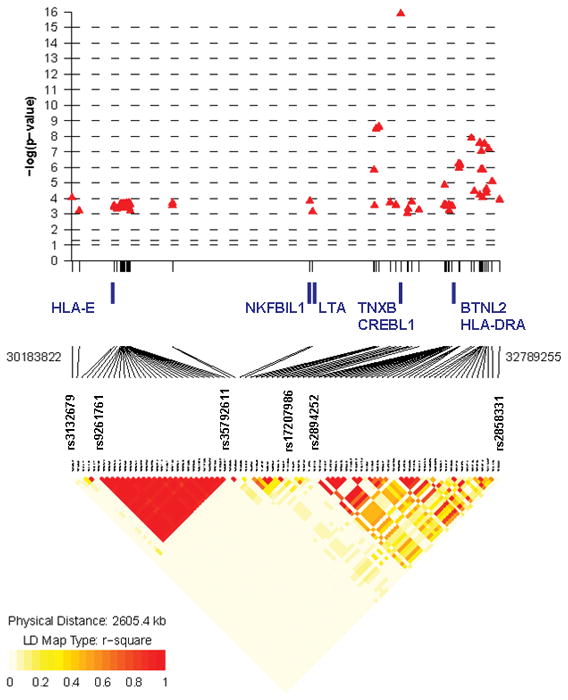
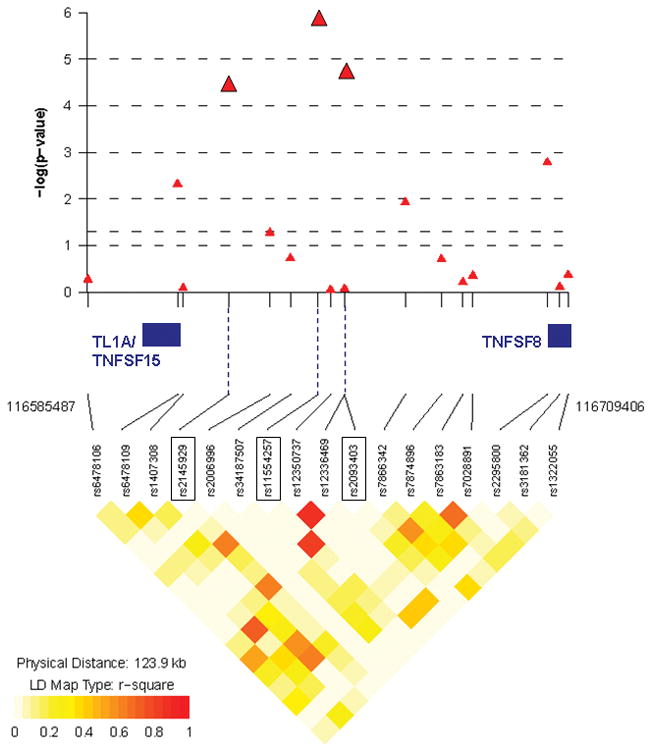
A) P-values and LD plot of 82 SNPs (p <1×10⁻³) on chromosome 6p of MHC region from MR-UC vs. healthy controls (analysis-III). Ten SNPs reached genome-wide significance (p ≤5×10⁻⁷), with an association peak at rs17207986 (p= 1.4×10⁻¹⁶). Leading and trailing SNPs, and SNPs bordering haplotype blocks are further identified (see Table S3 for complete list of SNPs). B) P-values and LD plot of 17 SNPs (p <1×10⁻³) within the TL1A/TNFSF15 and TNFSF8 regions on chromosome 9q from MR-UC vs. healthy controls (analysis-III). Three SNPs reached genome-wide suggestive significance (p <5×10⁻⁵): rs2145929 (p= 3.7×10⁻⁵), rs2093403 (p= 1.9×10⁻⁵), with an association peak at rs11554257 (p= 1.4×10⁻⁶). SNPs are represented as red triangles. LD heat map indicates level of linkage disequilibrium (r-squared) between SNPs. Chromosomal position of leading and trailing SNPs, and genes of interest located within this region are noted. (Generated with R package snp.plotter; http://cbdb.nimh.nih.gov/~kristin/snp.plotter.html)