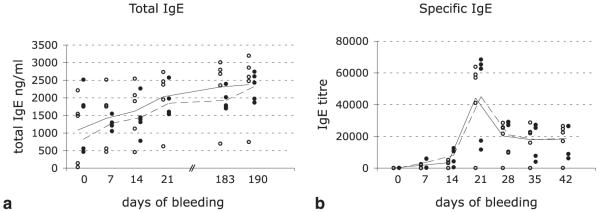
FIGURE 6.
Although specific IgE titers were successfully repressed, mAbA9 had no effect on already established total IgE titers. a, Total IgE levels of group 1 (open circles) and group 2 (closed circles) during the course of immunization. Mean values of the different groups are expressed as closed (group 1) or interrupted (group 2) lines. Differences between the groups for time point d21 and d190 for specific IgE were significant (p ≤ 0.01). For calculation of the p values the paired t test was used. b, Specific IgE titers of mAbA9-pretreated mice (closed circles) in comparison with untreated mice.

