
Figure 7.
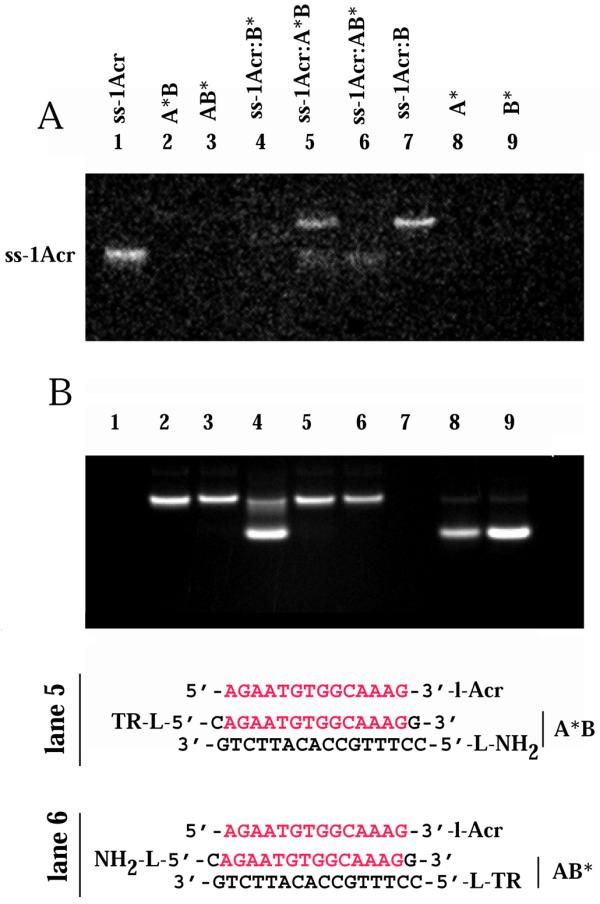
Non-denaturing gel band shift assay of the FRET samples. The concentration of the ss-1Acr strand was 28 µM, those of A, B, A-5′BODIPY-TR (A*) and B-5′BODIPY-TR (B*) were 100 µM. Lane 1, ss-1Acr; lane 2, A*B duplex; lane 3, AB* duplex; lane 4, ss-1Acr·B* duplex with excess B* strand; lane 5, ss-1Acr·A*B triplex; lane 6, ss-1Acr·AB* triplex; lane 7, ss-1Acr·B duplex; lane 8, ss A*; lane 9, ss B*. (A) Acridine fluorescence image of unstained gel at 496 nm, detected with a bandpass SKF-9 filter and excitation at 302 nm. (B) BODIPY-Texas Red fluorescence image of the same gel as in (A). Emission at > 630 nm, excitation at 366 nm.