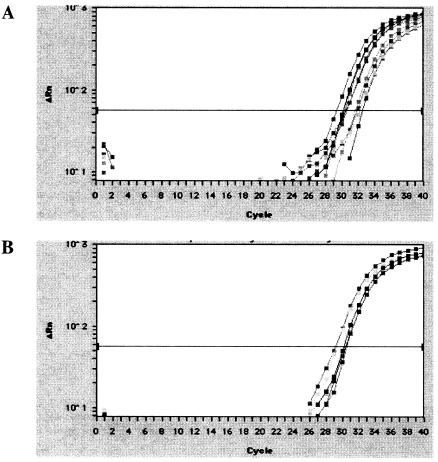
FIG. 6.
Comparison of the EBV genome load in EBV-positive breast carcinoma and normal breast tissues. Real-time quantitative PCR was performed with primers specific for the EBV BamHI-W fragment. Duplicate analysis of (A) five breast carcinoma samples (T2, T4, T5, T6, and T7) and (B) three normal breast samples (N2, N4, and N5) that were positive by RT-PCR for Zta expression. x axis, PCR cycle number. y axis, fluorescence intensity.

