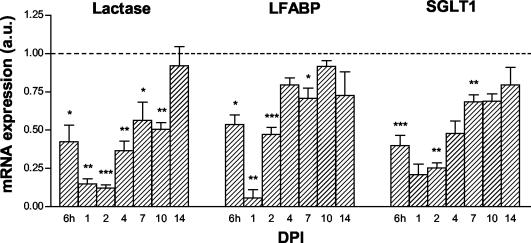
FIG. 9.
Quantitative analyses of enterocyte mRNA expression during rotavirus infection. Control values per day were arbitrarily set at a relative expression of 1 and are represented as a dotted line. At 6 hpi, enterocyte mRNA levels in the jejunum of infected animals were decreased compared to those of controls (dashed line). mRNA levels remained significantly decreased until 7 dpi (L-FABP and SGLT1) and 10 dpi (lactase). The amount of RNA spotted was corrected for GAPDH mRNA expression. Symbols: *, P < 0.05; **, P < 0.01; ***, P < 0.001 (versus control using Student's t test). Error bars, SEM; a.u., arbitrary units.

