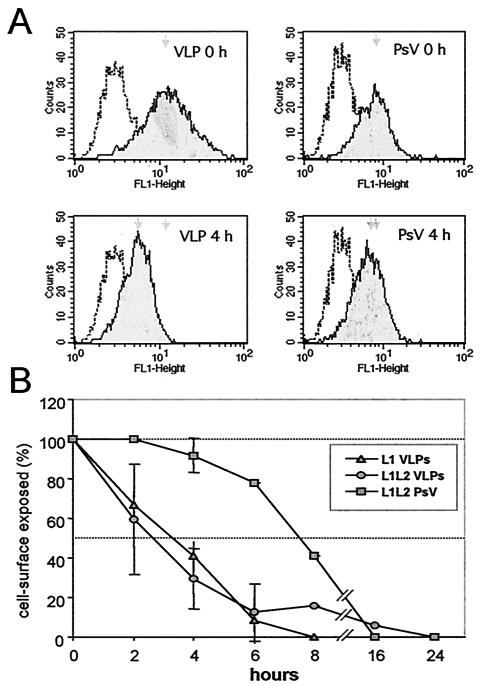
FIG. 3.
Fluorescence-activated cell sorting analysis of VLP and pseudovirus (PsV) internalization. (A) Histograms of cell surface-exposed particles after binding at 4°C (0 h) and further incubation at 37°C (4 h). (B) Time course of internalization of L1 VLPs, L1L2 VLPs, and L1L2 pseudovirions. Mean peak values of seven experiments (± the standard deviations) are shown. The half time of VLP and pseudovirus internalization differs by several hours.

