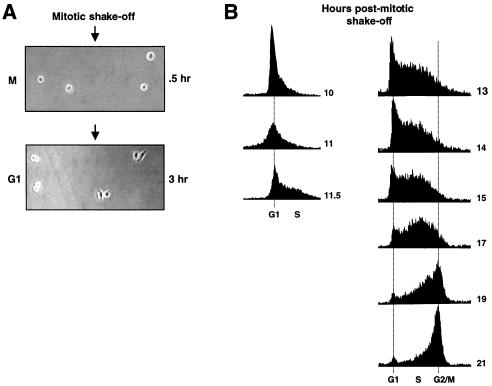
FIG. 2.
Synchronization of HeLa cells and delineation of S phase. (A) Mitotic HeLa cells were prepared by brief nocodazole treatment, shake-off, and replating. Phase-contrast micrographs of cells after replating and attachment (top, 0.5 h after plating) or after G1 entry (bottom, 3 h after plating) are shown. Different fields are shown in the two micrographs. Cell doublets that are flat, clearly indicating G1 entry (e.g., two colonies on the right), were typically marked prior to infection such that subsequent GFP segregation could be attributed to infection of synchronized cells. (B) HeLa cells were prepared by mitotic shake-off as in panel A and were analyzed for DNA content by FACScan analysis with standard techniques. Series on the left shows entry into S phase, and series on the right shows exit from S phase (from separate synchronization experiments). Time, in hours post-mitotic shake-off, is indicated to the right of each graph.

