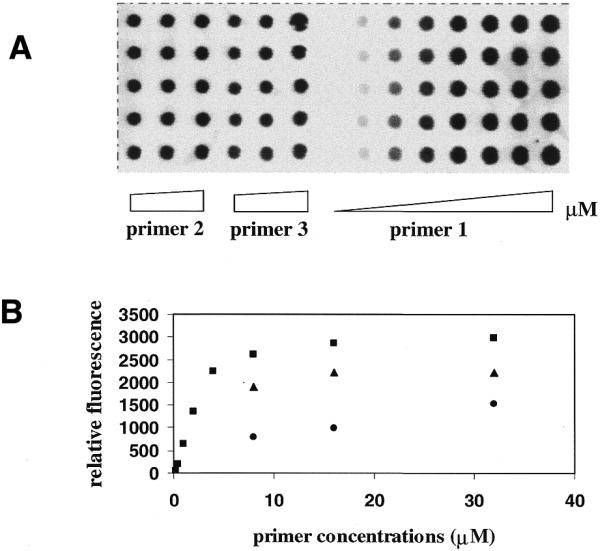
Figure 5.

(A) An image of primer extension on primer 1 at increasing concentrations of 0.25, 0.5, 1, 2, 4, 8, 16 and 32 µM and on primers 2 and 3 at increasing concentrations of 8, 16 and 32 µM. (B) A plot of relative fluorescence intensity of the Cy5-ddGTP-labeled primers versus concentration. Each data point is the average of the integral of five spots. Filled squares, primer 1; filled triangles, primer 2; filled circles, primer 3.
