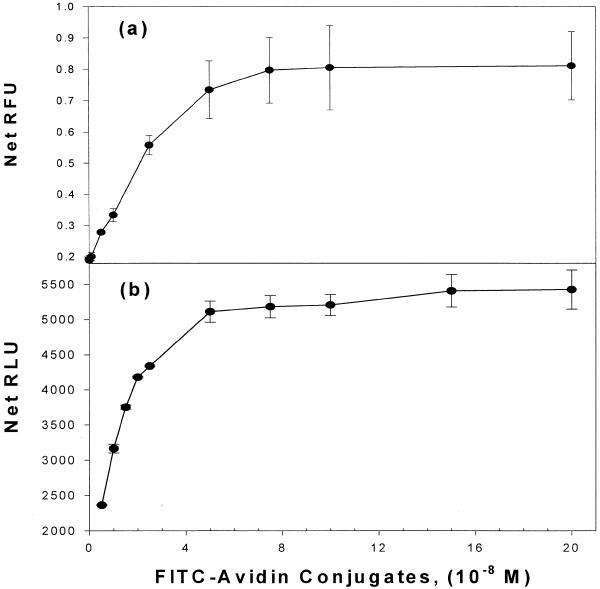
Figure 3.
Coating of microtiter plates with avidin. Results of avidin-coating experiments are shown for two different detection methods. The amount of avidin required to saturate a microwell is plotted versus the amount of FITC–avidin added to the wells with increasing concentrations of FITC–avidin until saturation as shown. (a) Relative fluorescence units (RFU) determined by fluorometry of bound avidin. Error bars denote the SD of at least four independent coating experiments. (b) FITC–avidin binding curves determined indirectly by an anti-FITC alkaline phosphatase antibody and chemiluminescence detection.

