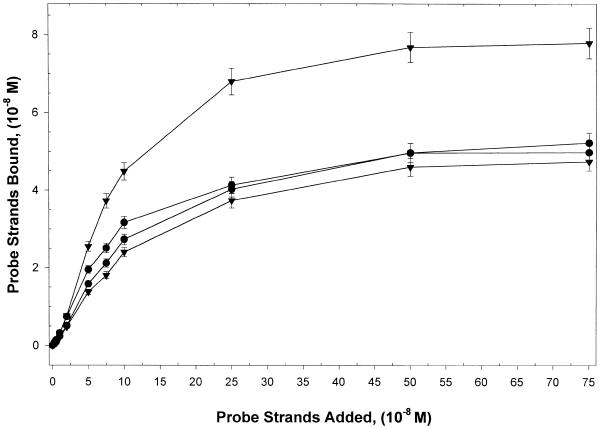
Figure 4.
Coupling of probes to the plate surface. Standard curves derived for each type of DNA probe where the amounts of biotinylated linear and hairpin probes bound to the surface are plotted against the amounts of probe added in 100 µl. Error bars are SDs of at least four independent experiments. Clearly, for the different types of probes the amounts coupled to the avidin wells increase with increasing amounts of added probe, but the amount of bound probe is not the same for all probes.

