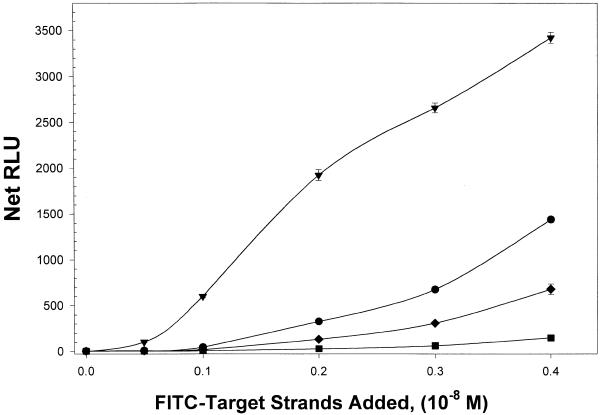
Figure 5.
Relative binding as a function of input target concentration. The summed RLU (net RLU), corresponding to captured FITC-labeled target strand, is plotted against the amount of target strand added for each type of probe. The 32 base hairpin (triangles) captured the highest quantity of FITC-target strand. At somewhat lesser amounts are the 16mer hairpins (circles), 32 base linear (diamonds) and 16 base linear (squares) probes. The avidin-coated wells were coated with 5 × 10⁻⁸ M probe strands.

