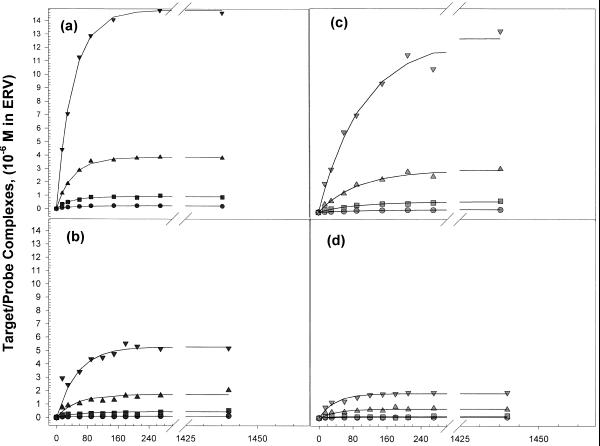
Figure 6.
Probe–target complex formation as a function of time. Plots of the concentration of target–probe complexes, [P*T], versus time for four target concentrations at 45°C are shown for each probe. (a) 32mer hairpin, (b) 16mer hairpin, (c) 32mer linear, (d) 16mer linear. Solid lines drawn through the data are best fits obtained from non-linear least square regression fits of the data with equation 6.

