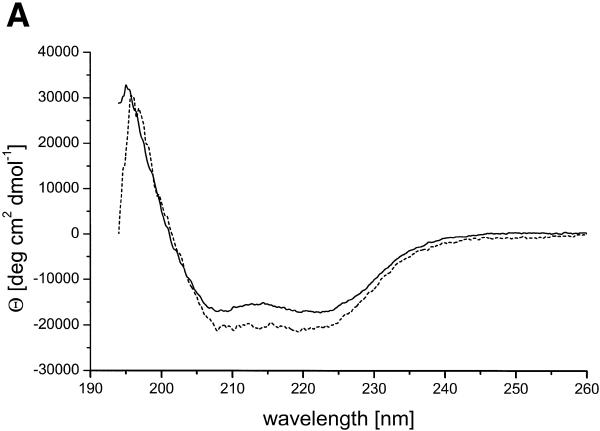
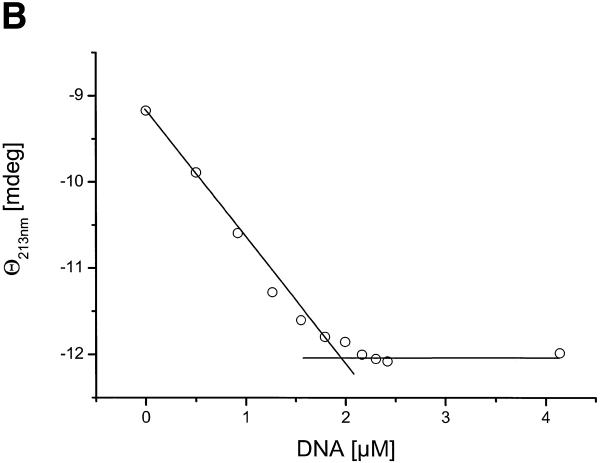
Figure 3.
UV CD spectra of ORF56. (A) CD spectra of 10 µM ORF56 free (continuous line) and complexed with 3.3 µM wt DNA (broken line) corrected for the background of DNA alone in standard buffer. (B) Decrease in the CD signal at 213 nm as a function of added wt DNA. The titration is stoichiometric (10 µM ORF56).


