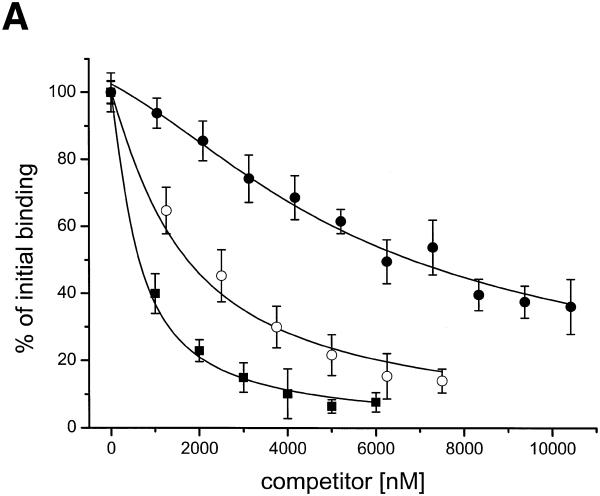
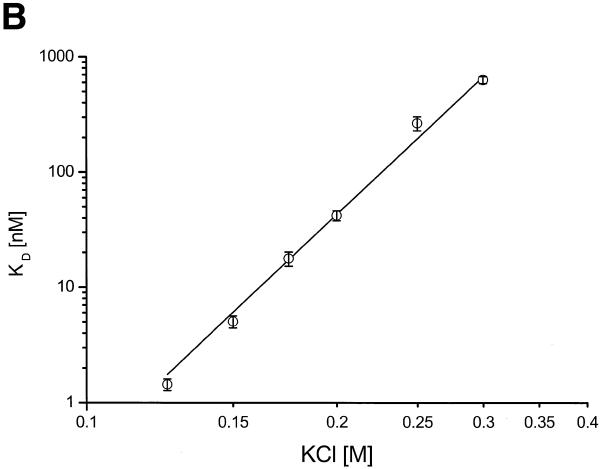
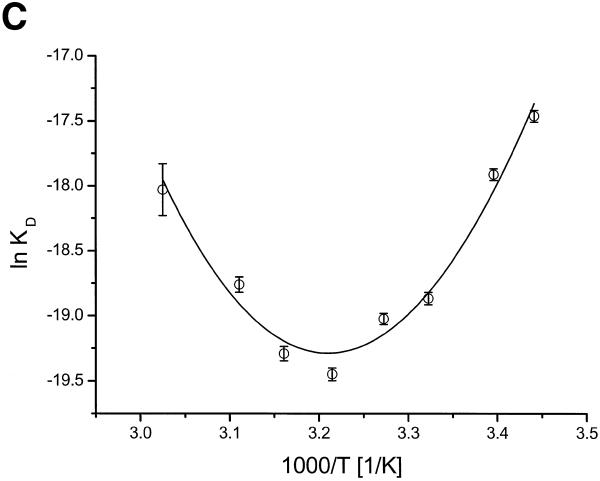
Figure 8.
Specificity, salt and temperature dependance of the ORF56 DNA-binding activity. (A) Competition experiments with non-specific DNA. ORF56 (20 nM) was allowed to bind to 2 nM fluorescently labelled wt DNA. Afterwards increasing amounts of competitor DNA were added. Filled squares, competition with rep DNA (single repeat substrate); open circles, competition with calf thymus DNA at 25°C; filled circles, competition with calf thymus DNA at 53°C. The calf thymus DNA concentration refers to the concentration of base pairs, which equals the concentration of overlapping sites. (B) Salt dependence of the dissociation constant. wt DNA (2 nM) was titrated in 10 mM Tris–HCl, pH 7.5, 0.01% Tween 20 with 125–300 mM KCl. The dissociation constant Kd at each salt concentration was calculated and plotted as a function of added salt. The calculated slope of the plot is 6.8 ± 0.2. (C) Temperature dependence of DNA binding. The temperature dependence of the dissociation constant was assayed at eight temperatures in the range 17–57°C. Fluorescently labelled wt DNA (5 nM) was titrated in cacodylate buffer with 150 mM KCl. The dissociation constants Kd were calculated at each temperature and plotted as lnKd versus 1/T (van’t Hoff plot). The data was fitted according to equation 4 (see Materials and Methods). ΔCp = –6.2 kJ/mol, TH = 39°C and TS = 47°C.


