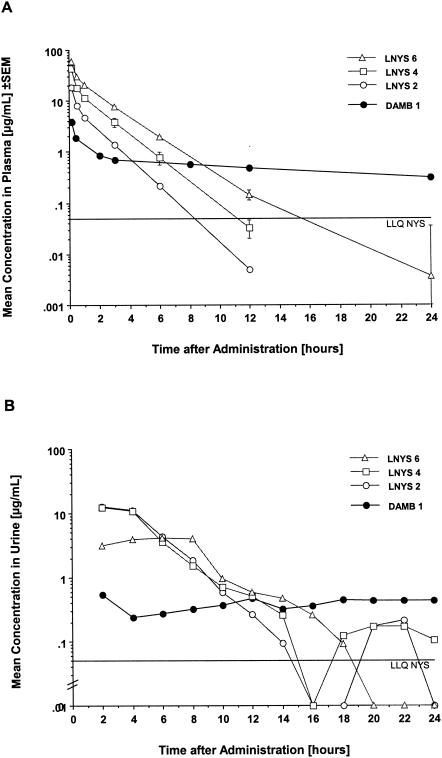
FIG. 1.
(A) Observed concentration-time plasma profiles after single dosages of 2, 4, and 6 mg of LNYS/kg or 1 mg of DAMB/kg. Each point represents the mean concentration for three rabbits each at that time ± SEM. Note that the error bars for LNYS at 2 mg/kg (LNYS 2) and DAMB at 1 mg/kg are included but are too small to be perceptible. Concentration-time points below LLQ were not used for pharmacokinetic modeling but are depicted for clarity of the plot. (B) Concentration-time urine profiles after administration of the same dosages described for panel A. Each point plots the mean concentration for three rabbits each for the respective 2-h urine fraction. The standard errors are omitted for clarity of the plot but can be appreciated from the assessment of pharmacokinetic parameters shown in Table 2. Note that concentration-time points below LLQ were set at 0 for pharmacokinetic calculations but are depicted for clarity of the plot.

