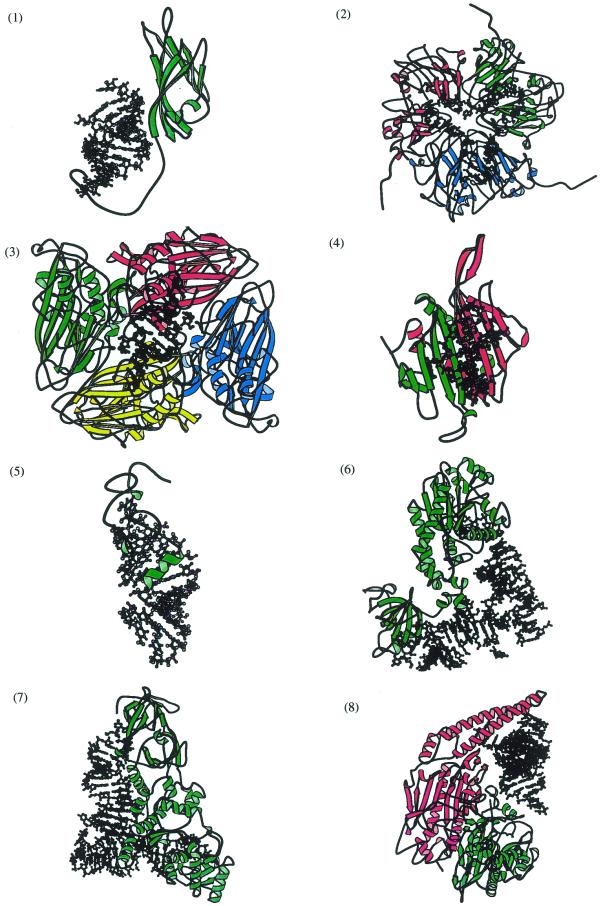
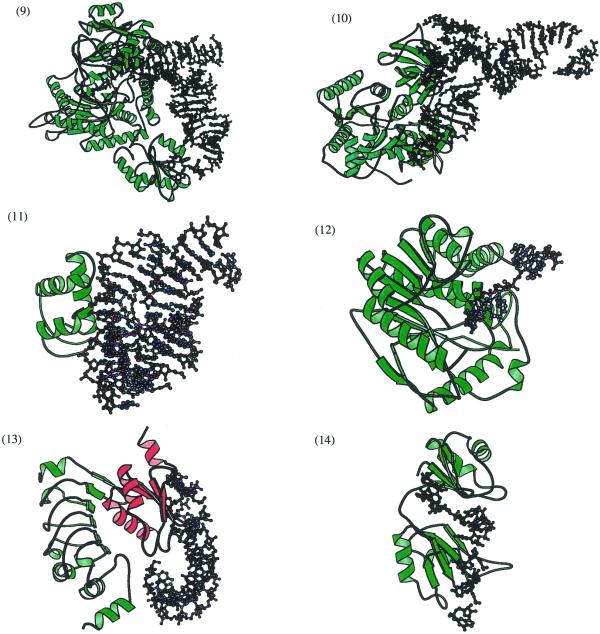
Figure 1.
MOLSCRIPT diagrams depicting protein–RNA complexes. One complex from each of the 14 families in Table 1 is presented. The sizes of the proteins are not comparable between diagrams and each is viewed from an angle that best depicts both the protein and RNA. In each diagram the RNA molecule is shown in ball-and-stick format and the proteins in ribbon format. Different subunits of the same protein are differentiated by colour. (1) Coat protein from Satellite tobacco mosaic virus (1A34); (2) bean pod mottle virus (middle component) (1BMV); (3) black beetle virus capsid protein (2BBV); (4) MS2 protein capsid (1ZDI); (5) HIV-1 nucleocapsid protein (1A1T); (6) aspartyl tRNA synthetase (1ASY); (7) glutaminyl tRNA synthetase (1QTQ); (8) seryl tRNA synthetase (1SER); (9) threonyl tRNA synthetase (1QF6); (10) elongation factor EF-TU (1TTT); (11) ribosomal protein L11 (1QA6); (12) methyltransferase VP39 (1AV6); (13) spliceosomal U2B″/U2A′ complex (1A9N); (14) sex-lethal protein (1B7F).


