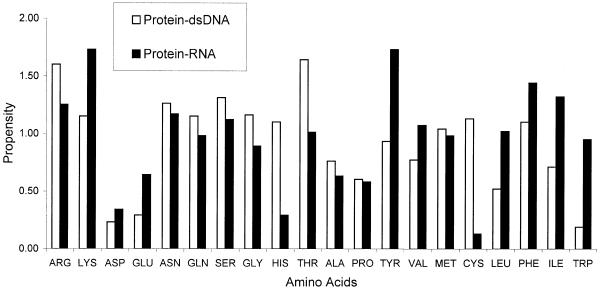
Figure 2.
Histogram of the interface residue propensities calculated for the protein–RNA complexes and compared to a dataset of protein–dsDNA complexes (25). A propensity of more than one denotes that a residue occurs more frequently in the protein–nucleic acid interface than in the remainder of the protein surface. The amino acid residues on the x-axis are ordered according to the Fauchere and Pliska (39) hydrophobicity scale, moving from the most hydrophilic residues on the left-hand side to the most hydrophobic on the right.

