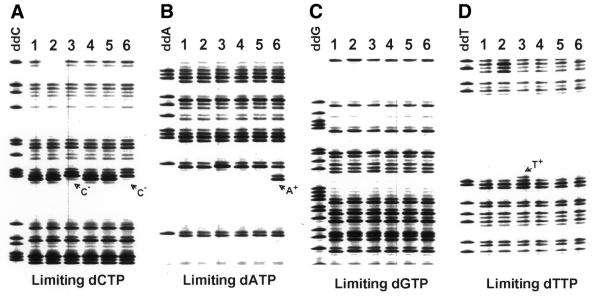
Figure 1.
Visualization of termination fragments of the supF gene using IRD-labeled primers. Four fluorescent DT–PCR reactions each with a different nucleotide limited were carried out for six samples and electrophoresed side by side on a denaturing 6% polyacrylamide gel mounted on an automated Li-cor DNA sequencer. The partial fluoroimage was visualized using IRD-labeled primer PS189NT800. The termination fragments visualized by primer PS189RT700 are not shown. The first lane in each group was a dideoxy sequence ladder generated as described in Materials and Methods. Substitution mutations were identified using correlated gain and loss of terminating bands in related DT–PCR reactions. For example, samples 3 and 6 had a transition from C:G to T:A and a transversion from C:G to A:T, respectively, at the sites indicated by arrows.

