
Figure 9.
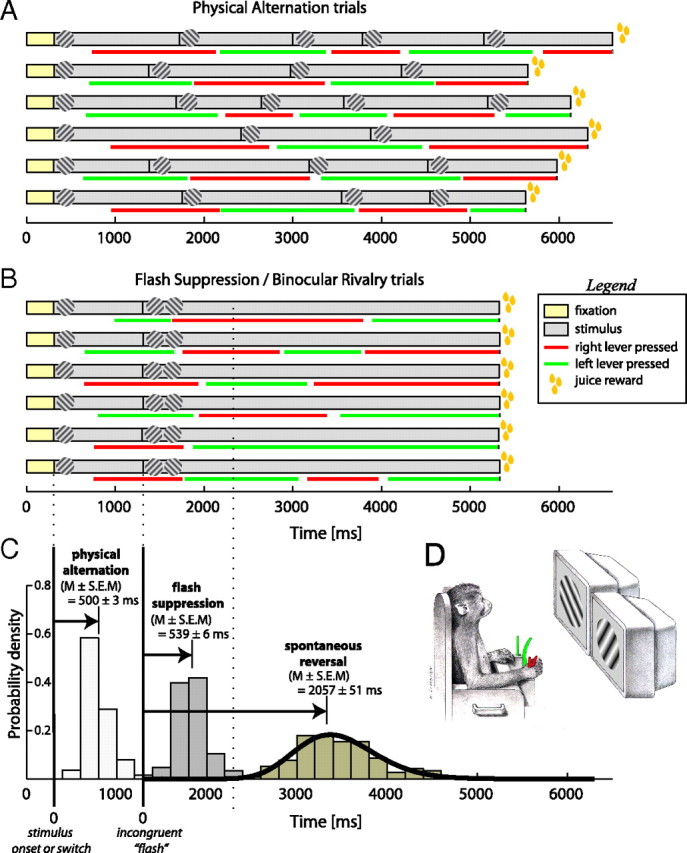
Behavioral responses analysis. A, Demonstration of 6 different physical alternation trials. Each trial started with the monkey fixating a central target for 300 ms (yellow bar) and then an orientation grating (one of two orthogonal orientations 45°/135°) was presented pseudo-randomly on the monitors. The monkey was required to respond by pressing a lever within a minimum time of 1 s. Responses of the monkey are indicated in red and green bars for right and left levers, respectively (see also diagram in D). Right lever was corresponding to the grating of 45° orientation while left lever to 135°. The monkey reported consistently the correct orientation in >95% of the trials. B, Demonstration of 6 different BFS/BR trials (see Materials and Methods for details). The trials started the same way with the monkey fixating a central target and a monocular orientation grating presented in one of the two eyes. The monkey responded in the same way and then after the period of 1 s, an orthogonal grating was switched on in the opposite eye. The monkey consistently (97% of trials) reported the newly presented stimulus. The stimuli were left on the screens for another 4 s and the monkey could report spontaneous reversals of his visual perception. C, Distributions of response times. On the left the distribution of response times to the presentation of the physical stimulus are presented. The monkey responded with a mean of 500 ± 3 ms (mean ± SEM). His responses to the BFS stimulus were at 539 ± 6 ms (mean ± SEM). Then the monkey reported spontaneous perceptual reversals on average after 2057 ± 51 ms (mean ± SEM). The distribution of spontaneous reversals was fitted significantly (Kolmogorov–Smirnov goodness-of-fit test, p = 0.001) by a gamma distribution (see Materials and Methods) with parameters r = 23.6 and λ = 10.9.