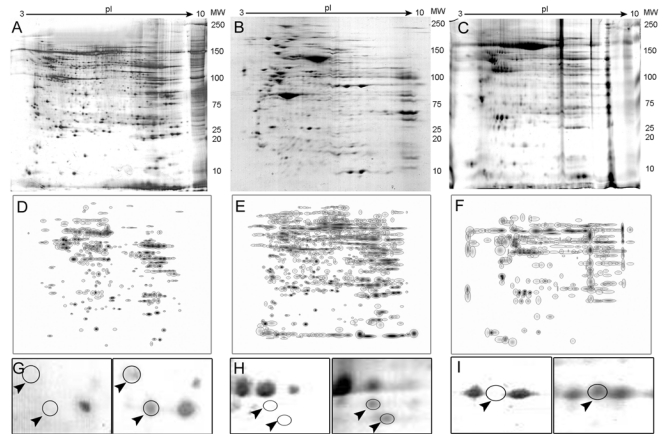
Figure 1.
Representative 2-D PAGE images. Full gels are shown for normal kidney (A), a clear cell carcinoma (B) and a chromophobe tumor (C). Composite images (master gels) resulting from combining all samples are shown in panels D-F also for normal, clear cell and chromophobe tumors. Differentially expressed protein spots are shown in panels G-I as indicated by arrowheads.

