
FIG 1 .
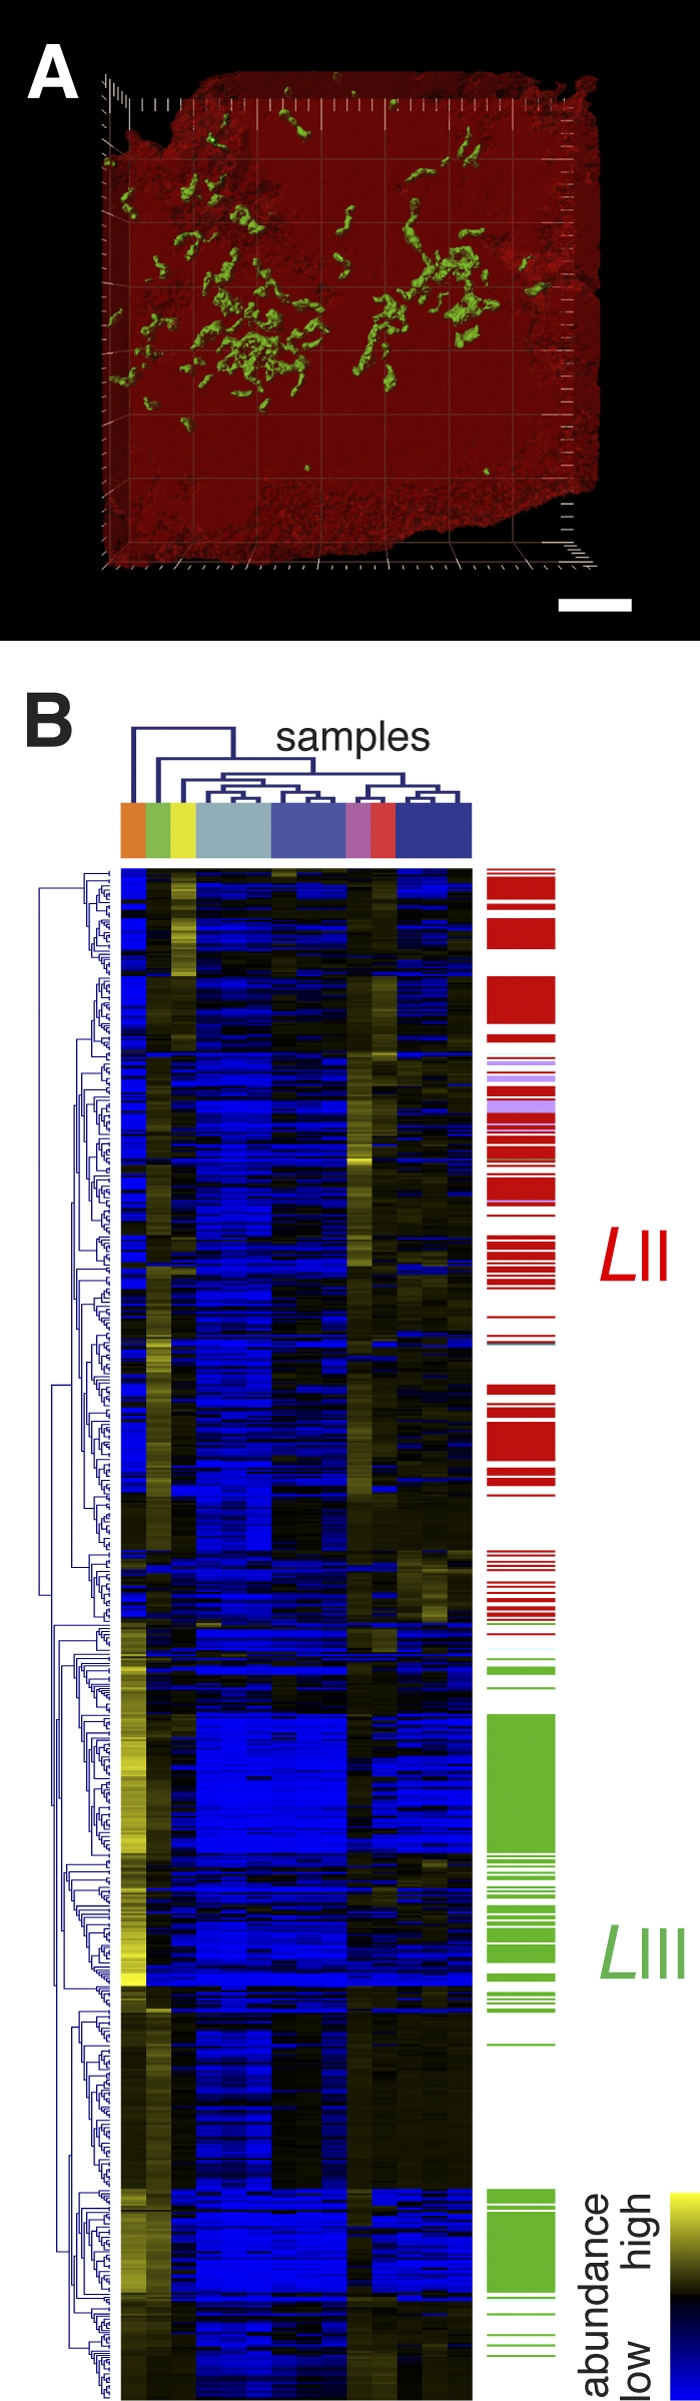
(A) Three-dimensional confocal laser scanning micrograph of biofilm collected from the ABM2 location following fluorescence in situ hybridization using Leptospirillum group II (red)- and III (green)-specific oligonucleotide probes. The scale bar is equivalent to 2 µm. (B) Hierarchical clustering (Pearson uncentered) of correlated proteins and metabolite features (r value, ≥0.9285; statistical P value, ≤0.0001). Distinct organismal clusters exist for Leptospirillum group II (identified proteins are indicated by red bars on the right) and Leptospirillum group III (identified proteins are indicated by green bars on the right). Sample color coding is defined in Fig. S1 in the supplemental material.