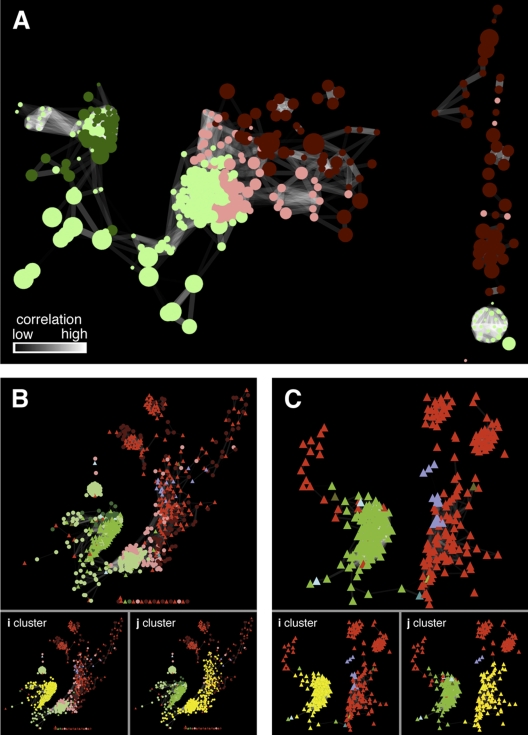
FIG 2 .
(A) Correlation network (r value, ≥ 0.9285; statistical P value, ≤0.0001) for all of the organism-specific metabolite features as defined by the clusters in Fig. 1B. (B) Correlation network of proteins and metabolite features (r ≥ 0.9285; statistical P value ≤0.0001). The two main clusters (i and j) of correlated proteins and metabolite features identified using the graph clustering algorithm FAG-EC (10) are highlighted in yellow. (C) Correlation network (r value, ≥ 0.9285; statistical P value, ≤ 0.0001) based on protein expression data. The two main clusters of correlated proteins are highlighted in yellow. Key to the color coding of nodes in networks: dark red circles, C18 reverse-phase metabolite features (primarily nonpolar metabolites) that fall within the Leptospirillum group II-specific cluster (Fig. 1B); pink circles, diamond hydride (DH) normal-phase metabolite features (primarily polar metabolites) that fall within the Leptospirillum group II-specific cluster; dark green circles, C18 metabolite features that fall within the Leptospirillum group III-specific cluster; light green circles, DH metabolite features that fall within the Leptospirillum group III-specific cluster; red triangles, proteins encoded by Leptospirillum group II; green triangles, proteins encoded by Leptospirillum group III; turquoise triangles, proteins encoded by a bacterium belonging to the phylum Firmicutes; olive triangles, proteins encoded by a bacterium belonging to the phylum Actinobacteria; light blue triangles, proteins encoded by A-plasma; purple triangles, proteins encoded by G-plasma. In all of the networks, the edges are shaded according to the significance of the correlations as highlighted in panel A (black, low; white, high).

