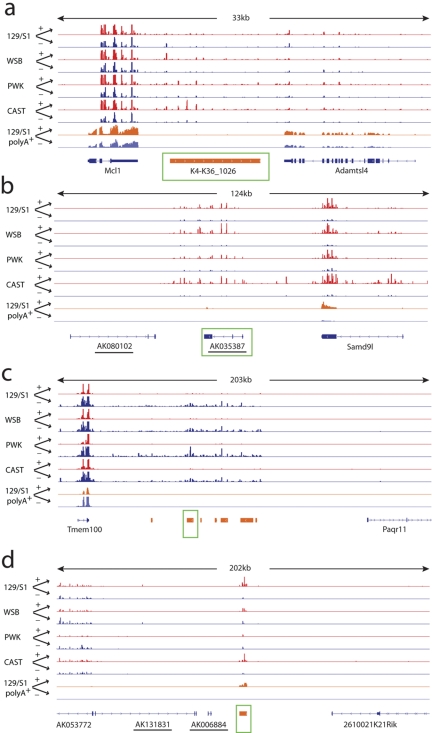
FIG 3 .
Examples of annotated ncRNA loci (a and b) and nonannotated genomic regions (c and d) differentially expressed during SARS-CoV infection. (a) An overview of short reads from whole-transcriptome analysis of mouse lung samples mapped to a 33-kb region of chromosome 3 displayed by Integrative Genome Viewer (IGV) browser (http://www.broadinstitute.org/igv). Each track represents data collected from a single mouse lung sample, with SARS-CoV-infected sample (+) and mock-infected sample (−) shown by the labeled arrows (+ or −). Infected samples are depicted in red, and mock-infected samples are depicted in blue. The strains of mice used are shown on the left. 129/S1 polyA+ represents short-read data generated from libraries separately created from the same samples with poly(A) selection. For reference, UCSC annotation of nearby protein-coding genes is shown at the bottom in blue. K4-K36_1026 is the entire K4-K36 domain of a large intervening ncRNAs (lincRNA) as identified in reference 7, which is upregulated during SARS infection, but no significant expression was observed in poly(A)-selected samples. The green box indicates that the locus was followed up using qPCR (the same for panels b, c, and d). (b) Overview similar to that in panel a for a 124-kb region of chromosome 6. The underlined UCSC annotation is noncoding. It was upregulated during SARS-CoV infection. (c) Overview similar to that in panel a for a 203-kb region of chromosome 11. The loci shown in orange indicate nonannotated genomic regions identified here as differentially expressed during SARS-CoV infection (as in panel d). These regions were downregulated. (d) Overview similar to that in panel a for a 202-kb region of chromosome 12. The locus in orange indicates an nonannotated genomic region upregulated during SARS-CoV infection.

