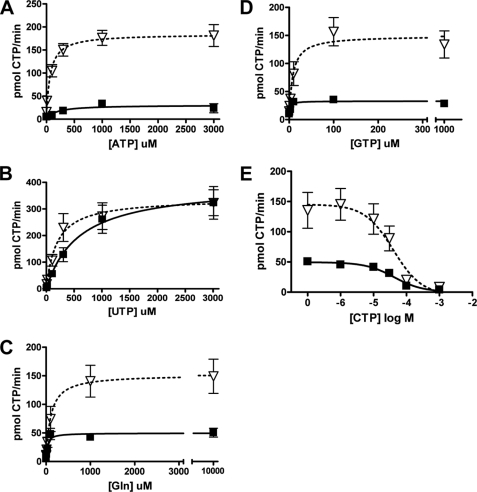
FIGURE 1.
Influence of substrates and allosteric effectors on hCTPS1 and hCTPS2 activity. HEK293 cells expressing hCTPS1-FLAG (solid squares, solid line, black bar) and hCTPS2-FLAG (open triangles, dotted line, gray bar) were lysed, immunoprecipitated with FLAG antibody conjugated to agarose beads, and assayed for CTPS activity. The samples were incubated with the indicated ATP (A), UTP (B), or glutamine (C) concentrations for 1 h (CTPS1) or 15 min (CTPS2) at 37 °C. Alternatively, the samples were incubated with the indicated effectors GTP (D) or CTP (E) concentrations for 1 h (CTPS1) or 15 min (CTPS2) at 37 °C. All of the data are expressed as pmol/min CTP formed and are from three (CTPS1) or four (CTPS2) experiments.

