
FIGURE 4.
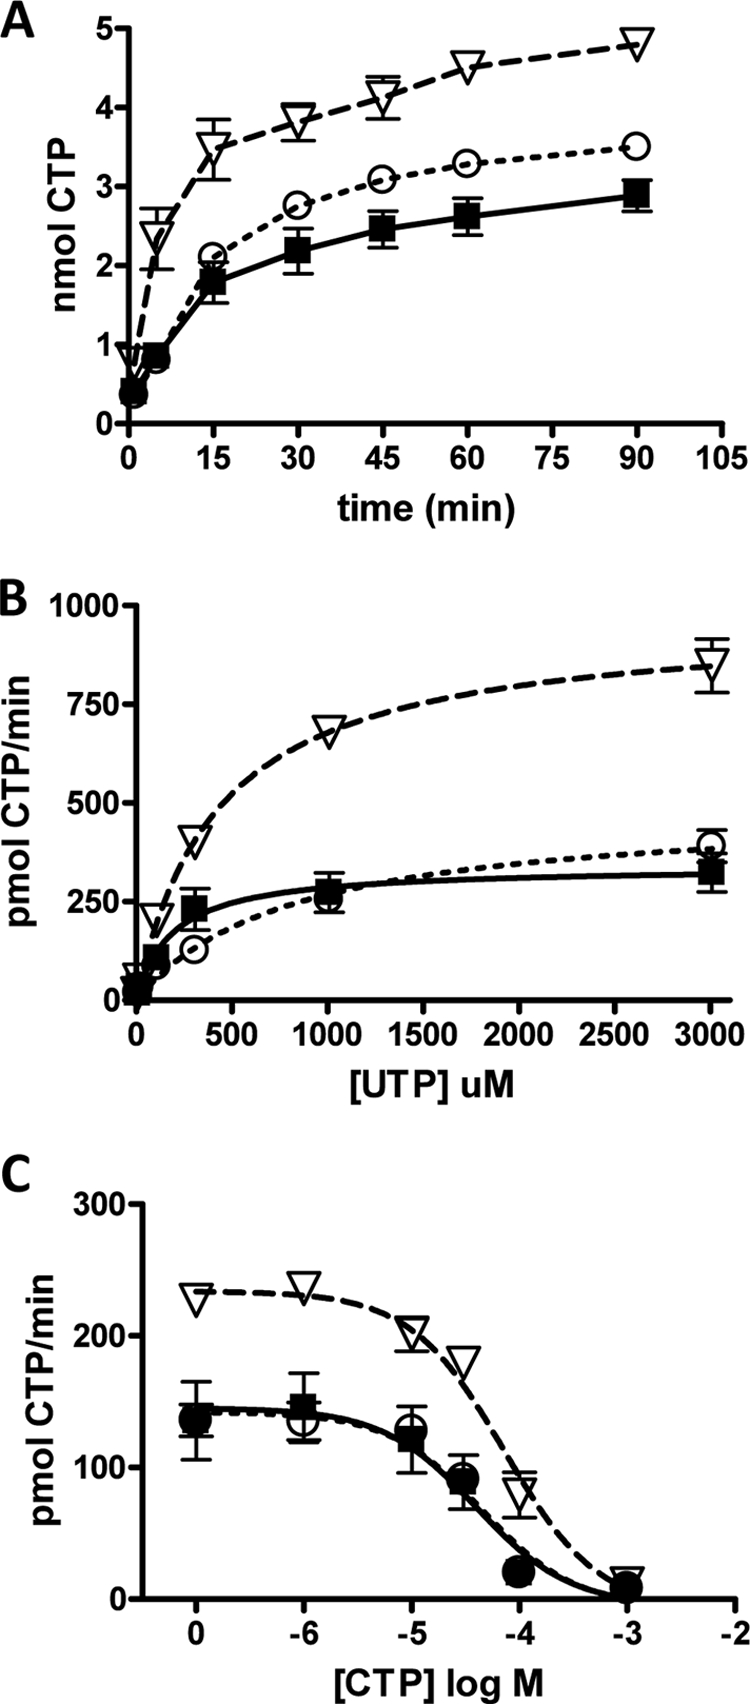
Effect of phosphorylation site mutations on hCTPS2 activity. HEK293 cells expressing WT-hCTPS2-FLAG (solid squares, solid line), hCTPS2-S568A-FLAG (open triangles, dashed line), or hCTPS2-S571A-FLAG (open circles, dotted line) were lysed and assayed for CTPS activity as described above. A, samples were incubated for the indicated time intervals at 37 °C from 1 to 90 min. The data are expressed as nmol of CTP formed and are from three separate experiments. Note that the y axis of A is expressed as nmol of CTP synthesized, not pmol/min CTP as on the other graphs. B, samples were incubated with the indicated UTP concentrations for 15 min at 37 °C. C, samples were incubated with the indicated CTP concentrations for 15 min at 37 °C. The data in B and C are expressed as pmol/min CTP formed and are from three separate experiments. Note that the WT-hCTPS2 data are the same data as presented in supplemental Fig. 1B and Fig. 1 (B and E) and are shown here for comparison purposes.