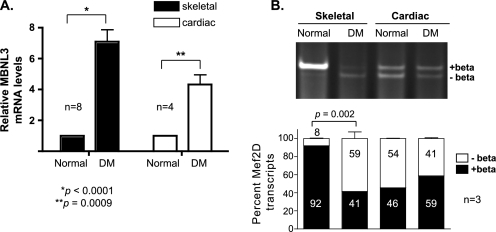
FIGURE 8.
MBNL3 expression and Mef2D β-exon splicing in muscle of DM patients. A, MBNL3 transcript levels. Total RNA was isolated from psoas (skeletal) and heart (cardiac) muscle tissue obtained from two normal and two age/gender-matched DM patients. The level of MBNL3 expression was determined by quantitative RT-PCR. GAPDH transcript levels were measured to control for RNA input. Relative MBNL3 mRNA levels were calculated using the conventional 2−ΔΔCt method (29). The p values for significant differences are provided and indicated by the asterisks. B, Mef2D β-exon splicing. Mef2D(−)β and (+)β transcript levels in total RNA prepared from normal and DM patient tissues were determined by RT-PCR using human specific primers. Amplified products were separated on polyacrylamide and visualized by ethidium bromide staining. Relative intensity of (+)β and (−)β splice products was determined using National Institutes of Health Image J software and used to calculate the percentage of total Mef2D transcripts for each isoform (n = 3). Significant differences are indicated by the p value.

