FIGURE 1.
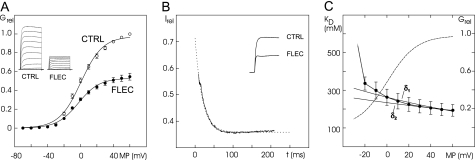
Effect of 200 μmol/liter FLEC on Kv2.1 K+ currents and conductance. A, open probability curves of mean conductance values from eight experiments. Inset, original recording of one experiment (maximal amplitude, 21.7 μA; voltage step duration, 500 ms). Shown are potential steps from −80 to +60 mV under control conditions (CTRL, open circles) and with FLEC (filled circles). The conductance values (Grel) were normalized to the respective maximal value under control conditions. B, change of fractional current (Irel), i.e. fraction of current with FLEC relative to current under control conditions (CTRL), with the duration (t) of voltage steps to +60 mV (except for the first 8 ms). The trace is the mean of seven experiments. Hatched line, fit of Irel with a monoexponential function. The fit is shown from 0 to 250 ms of the voltage step. Inset, original recording of currents at +60 mV (maximal amplitude, 25.7 μA; voltage step duration, 200 ms). C, voltage dependence of a fraction of block. The half-blocking concentrations (KD) at different potentials are given as mean ± S.E. of six experiments (filled circles, dotted line). The hatched line gives the open probability curve obtained by fitting the relative conductance values (Grel) current amplitude with a Boltzmann equation. The fit was performed with the measured KD0 of 263 μmol/l (δ1 = 0.17 ± 0.01) and with an unknown KD0 (δ2 = 0.10 ± 0.03, KD0 = 200 μmol/liter; n = 6, solid lines). The error bars indicate S.E. MP, membrane potential.

