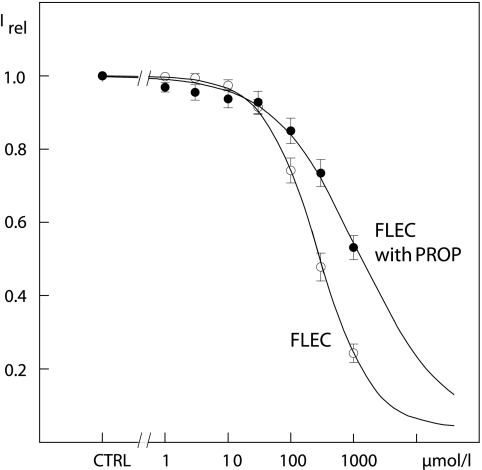
FIGURE 4.
Concentration-response curves for FLEC (open circles) and for FLEC in the background of 100 μmol/liter PROP (filled circles). The symbols represent currents relative to the maximal current under control conditions at +60 mV as mean ± S.E. of six and seven experiments. Irel, fraction of current with FLEC relative to current under control conditions (CTRL). The data were fitted to Langmuir equations.

