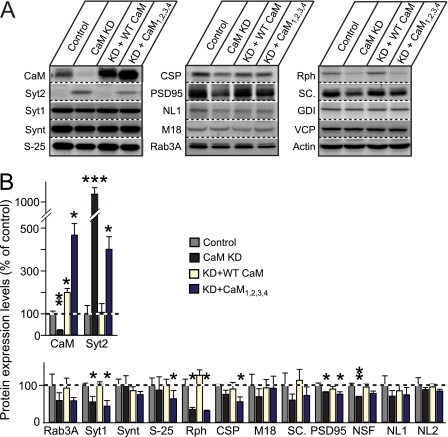
FIGURE 5.
Quantitation of CaM KD-induced changes in protein levels. Cultured cortical neurons from newborn wild-type mice were infected at DIV 5 with control lentivirus or with CaM KD lentivirus expressing CaM shRNAs without a CaM mRNA or with either wild-type CaM rescue mRNA (+ WT CaM) or a mutant CaM rescue mRNA (+ CaM1,2,3,4) and analyzed at DIV 14. A, representative immunoblots of neuronal proteins using primary antibody against the different proteins as indicated and 125I-conjugated secondary antibodies followed by PhosphoImager detection. B, summary graphs of protein levels measured by quantitative immunoblotting. The data shown are the means ± S.E. *, p < 0.05; **, p < 0.01 as analyzed by Student's t test (n = 3 independent cultures). Synt, syntaxin-1; S-25, SNAP-25; CSP, cysteine string protein; NL1, neuroligin-1; M18, Munc18-1; Rph, rabphilin; SC., secretory carrier membrane protein; GDI, GDP dissociation inhibitor; NL2, neuroligin-2.

