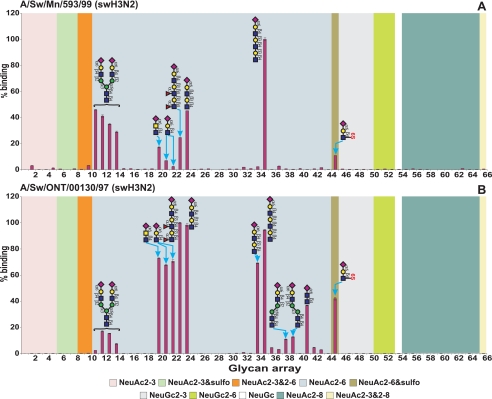
FIGURE 3.
Glycan microarray analysis of Sw/MN and Sw/ONT viruses. Sw/MN (A) and Sw/ONT (B) binding to glycans was performed on microarray version 4.1 from the Consortium for Functional Glycomics. Results shown are the average of four replicate spots ± S.E. after the highest and lowest readings of six were excluded, with the highest value set to 100. As the binding of all asialo- and α2–3-sialylated glycans was below 1.5%, the structures of only five α2–3-sialylated glycans are plotted on the graph for clarity of presentation. For complete glycan sequences and relative luciferase units of viruses binding to all glycans see supplemental Table S4.

