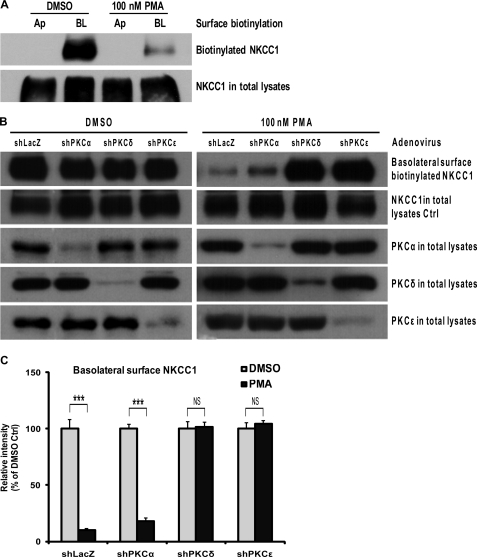
FIGURE 6.
Surface biotinylation assay for the membrane surface NKCC1 expression. T84 cell monolayers were grown to confluence on Transwell supports (24-mm insert diameter). A, cells were treated with vehicle (DMSO) or 100 nm PMA for 1 h, and then cell surface biotinylation assays were performed at either the apical (Ap) or basolateral side (BL) of Transwell supports and the cell lysates were subjected to Western blotting using primary mouse anti-NKCC1 T4 antibody. Shown are representative blots of three independent experiments. B, cells were infected with non-targeting shLacZ-adenovirus and with shPKCα-, shPKCδ-, or shPKCϵ-adenovirus (m.o.i. = 30) for 72 h before treatment with vehicle (DMSO, left panel) or 100 nm PMA (right panel) for 1 h. The basolateral surface biotinylation assay was then conducted and the cell lysates were analyzed by Western blotting. The first row blots from the top represent the dynamic change of biotinylated NKCC1 protein after PMA or DMSO treatment in the four groups of shLacZ-, shPKCα-, shPKCδ-, and shPKCϵ- cells. The second row blots show the total NKCC1 protein expression. The third, fourth, and fifth row blots indicate the expression levels of PKCα, PKCδ, and PKCϵ, respectively, in the total cell lysates. The blots shown are representative of three independent experiments. C, blot bands of basolateral surface biotinylated NKCC1 were quantified by densitometry, and data from the three experiments were analyzed with unpaired t test after normalization to respective NKCC1 in total lysates. The data are presented as the percentage of DMSO control (mean ± S.E., n = 3). ***, p < 0.001; NS, not significant.

