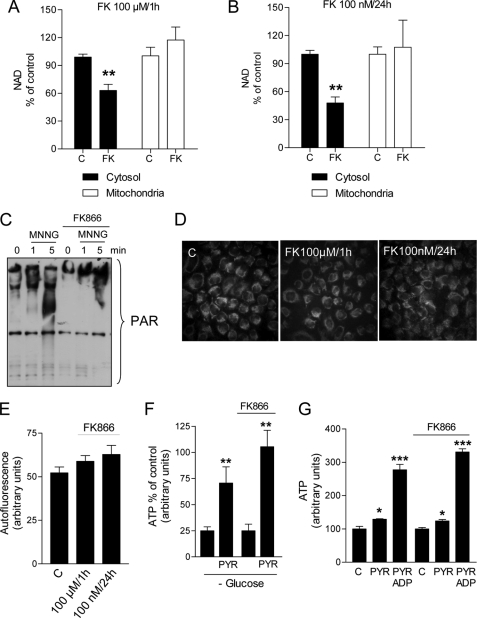
FIGURE 3.
Effects of FK866 on subcellular NAD contents, poly(ADP-ribose) formation, and ATP production. Quantitation of cytosolic and mitochondrial NAD contents in HeLa cells exposed to FK866 at 100 μm for 1 h (A) or 100 nm for 24 h (B). C, Western blotting evaluation of the effects of FK866 (100 nm/24) on poly(ADP-ribose) (PAR) formation prompted by the PARP-1 activator MNNG (100 μm). Note that poly(ADP-ribosyl)ated proteins appear as a smear due to their highly increased molecular weight. D, visualization of autofluorescence in cells under control conditions or exposed to FK866 at 100 μm for 1 h or 100 nm for 24 h. E, quantitation of cell autofluorescence of cells shown in D. F, ATP content of cells exposed or not to 100 nm FK866 for 24 h, cultured overnight in the absence of glucose, and pulsed for 1 h with 1 mm pyruvate (PYR). Values represent the % of ATP of cells cultured in the presence of glucose (control). G, ATP production by mitochondria isolated from control or FK866-challenged cells and exposed 5 min to 1 mm pyruvate (PYR) or 1 mm pyruvate plus 3 μm ADP. In A, B, F, and G, each column represent the mean ± S.E. of 7 (A), 5 (B), or 3 (F and G) experiments. In C the blot is representative of three different experiments. In D an experiment representative of 4 is shown. In E each column represents the mean ± S.E. of the fluorescence present in each microscopic field (3 fields per slide have been acquired). A and B, *, p < 0.05; **, p < 0.01; ***, p < 0.001 versus control. Analysis of variance and Tukey's post hoc test were used.

