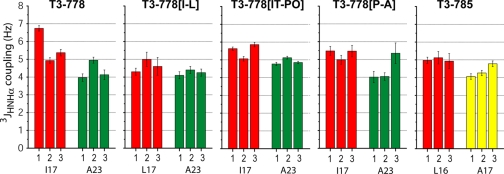
FIGURE 5.
3JHNHα-coupling values of model peptides T3–778, T3–778[I-L], T3–778[IT-PO], T3–778[P-A], and T3–785. For the T3–778 series, Ile17/Leu17 and Ala23 are in the X position and colored in red and green, respectively. For T3–785, Leu16 in the X position is colored in red, and Ala17 in the Y position is colored in yellow.

