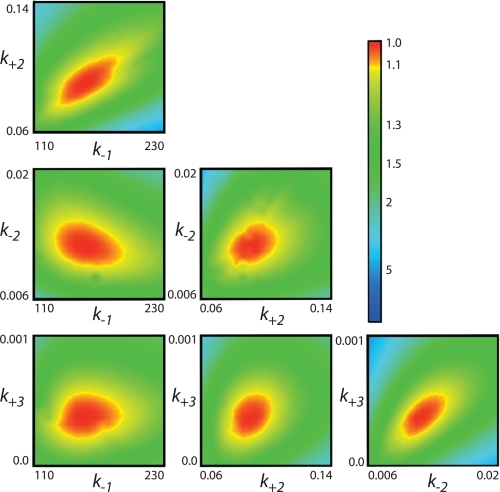
FIGURE 5.
Confidence contours for the global fit to four rate constants showing all six pairwise combinations of the four rate constants. The results were derived by globally fitting the data collected as shown in Fig. 3B. The central red zone shows the area of good fit, and the yellow band between the red and green zones shows the threshold representing a 10% increase in χ2, which is used to set upper and lower confidence limits on each of the kinetic parameters (21).

