
Fig. 3.
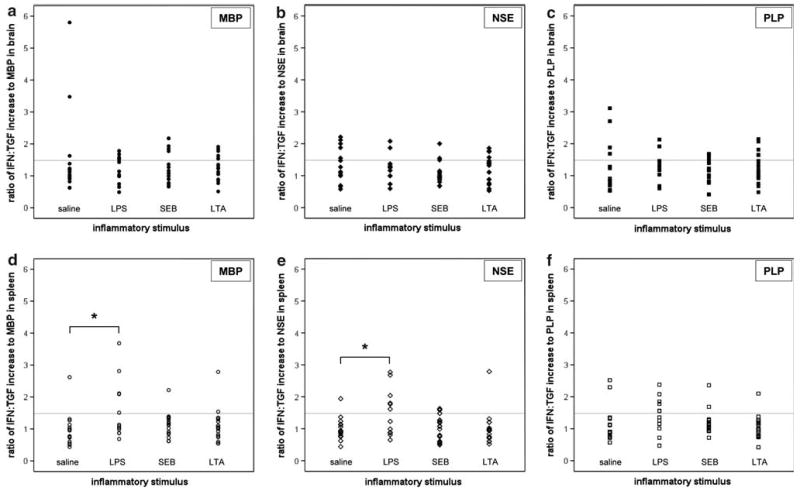
Th1 responses to MBP, NSE and PLP; individual animal data. Individual animal data are presented and depict the ratio of the relative increase in the number of cells responding to MBP, NSE and PLP with the secretion of IFN-γ to that responding with the secretion of TGFβ-1 among mononuclear cells isolated from brain (a–c) and spleen (d–f). A value ≥1.48 (gray line) is considered indicative of a Th1 response. * P < 0.05 compared to saline treatment using ANOVA with post-hoc Dunnet's