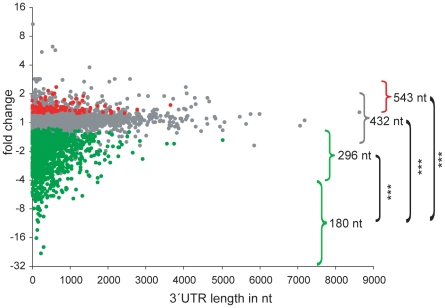
Figure 7. Transcript signal reduction correlates with a shorter 3′UTR length.
The average signal fold change of probesets, which were scored as consistently increased, not changed and decreased in all 4 cross-comparisons, were plotted against the length of the 3′UTR. Probesets receiving decreased (N = 1134), not changed (N = 4050) and increased change (N = 107) calls in the Affymetrix comparison analysis (MAS 5.0 statistical algorithm) are given in green, grey and red, respectively. Transcripts classified according to signal alterations upon aging, i.e. >4-fold decrease, <4-fold decrease, not changed and increased, are marked with brackets and the median length of the 3′UTR of each class is given. Highly significant p-values between >4-fold decreased transcripts and all other classes derived by Mann-Whitney test are indicated (*** p-value<0.001).

