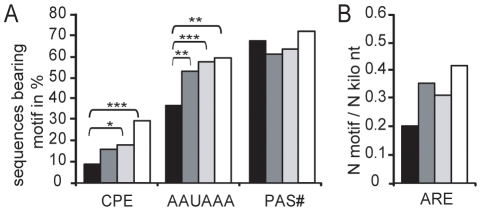
Figure 8. Abundance of CPE, PAS and ARE in the 3′UTR of transcripts deadenylated upon egg aging.
Transcripts were classified according to their signal alteration magnitude: >4-fold decreased (black, N = 98), 4>x>2-fold decreased (dark grey, N = 403), <2-fold decreased (light grey, N = 496) and increased (white, N = 96). (A) Percentage of mRNA sequences bearing at least one canonical PAS (AAUAAA), one non-canonical PAS (PAS#) or one CPE in the 3′terminal 100nt for each transcript category are given. *, ** and *** denote p-values of <0.05, p<0.01 and p<0.001 using Fisher's exact test, respectively. (B) Abundance of ARE in the entire 3′UTR was normalized against the total 3′UTR length of the corresponding transcript class and analyzed using Mann-Whitney test.

