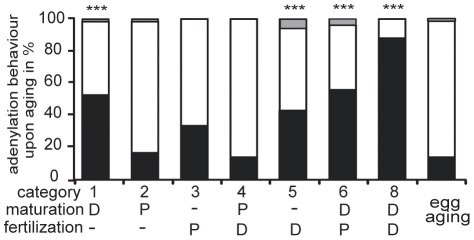
Figure 9. Distribution of maternal transcripts deadenylated upon egg aging to the RNA categories with distinct adenylation behavior at egg maturation and upon fertilization.
The transcripts of each category defined according to their deadenylation and/or polyadenylation were classified in percentage whether they are decreased (black), not changed (white) or increased (grey) upon egg aging. Deadenylation (D) and polyadenylation (P) at egg maturation and upon fertilization for each category is given. Category 7 is not shown as this type of behavior was not observed [15]. For comparison the percent distribution of decreased (black), not changed (white) and increased (grey) transcripts in aged eggs of all transcripts measurable by Affymetrix microarrays is given. Statistically significant differences in the distribution of the categories compared to all measured transcripts are indicated by three asterixs (p<0.0001 by chi square statistics).

