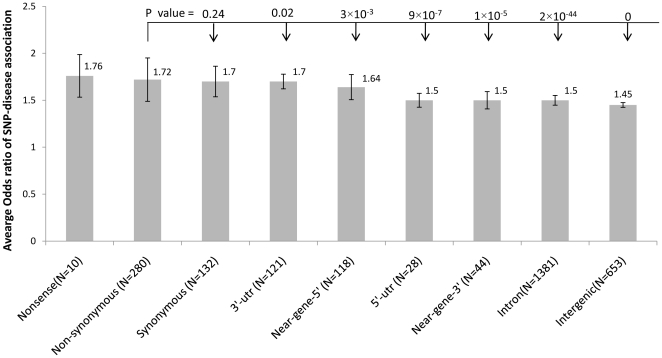
Figure 4. Impact of SNP types on the effect size of SNP-disease association.
The median odds ratio±standard error was calculated for each of the nine SNP types using 9,574 curated SNP-disease associations. The number of distinct SNPs was specified in the parenthesis. The odds ratios of nonsense SNPs were significantly higher than those of other SNP types (p<0.05, Mann-whiney U test). The p-values between the odds ratios of nsSNPs and other type of SNPs were shown in the figure.

