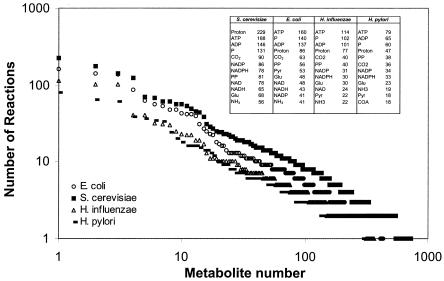
FIG. 1.
Frequency plot of the number of reactions that each metabolite appears in for four different reconstructed metabolic networks. For each metabolic network the 10 metabolites that appear in the most reactions are listed. PP, pyrophosphate; COA, coenzyme A. The numbers in the box specify the numbers of reactions the 10 most frequently used metabolites participate in for the four different microorganisms.

