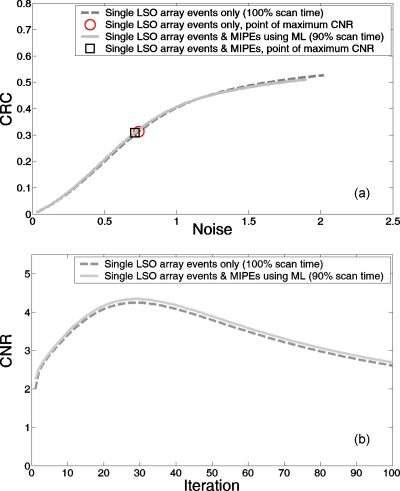
Figure 13.
(a) Contrast recovery coefficient-noise curves of images reconstructed using the single LSO array data for 100% scan time compared to those based on the MIPEs-ML method over 90% scan time. Graph shows the CRC and noise values derived from the 2 mm diameter spheres. Curves for the 4 and 8 mm diameter spheres exhibit similar behavior. (b) Contrast to noise ratio as a function of the number of MLEM iterations. Plotted are curves derived from the 2 mm diameter spheres reconstructed using the single LSO array data for the full scan time and using the MIPEs-ML method over 90% of the scan time.

