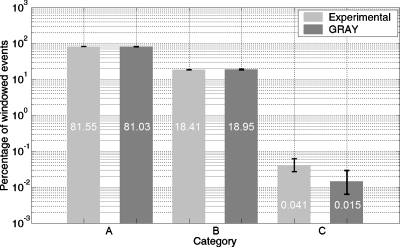
Figure 8.
Experimental vs GRAY simulation result comparison of photon interaction categories (see Fig. 4 for the definitions, categories E and D are not applicable here for the case of edge-on irradiation of one dual-LSO-PSAPD module). Note that the vertical axis is in logarithmic scale, and 100% corresponds to all events with sum energy within a 511 keV±20% window. The statistical uncertainty in the results is shown as error bars on each bar, indicating the 90% confidence interval.

