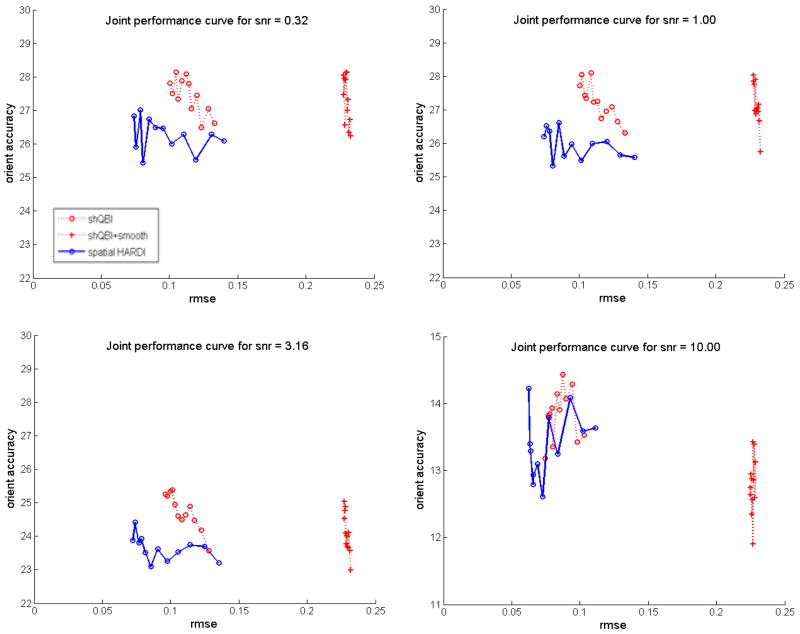
Figure 6.
Joint performance curves of reconstruction methods for various SNR levels. In each case the regularization parameter λ was varied in the range [0.05, 0.3] in 12 increments. Spatial HARDI reconstruction was performed at μ equal to λ in order to reduce possible degrees of freedom. The first three plots are shown on the same axes, and the last one on a different one for ease of viewing.

