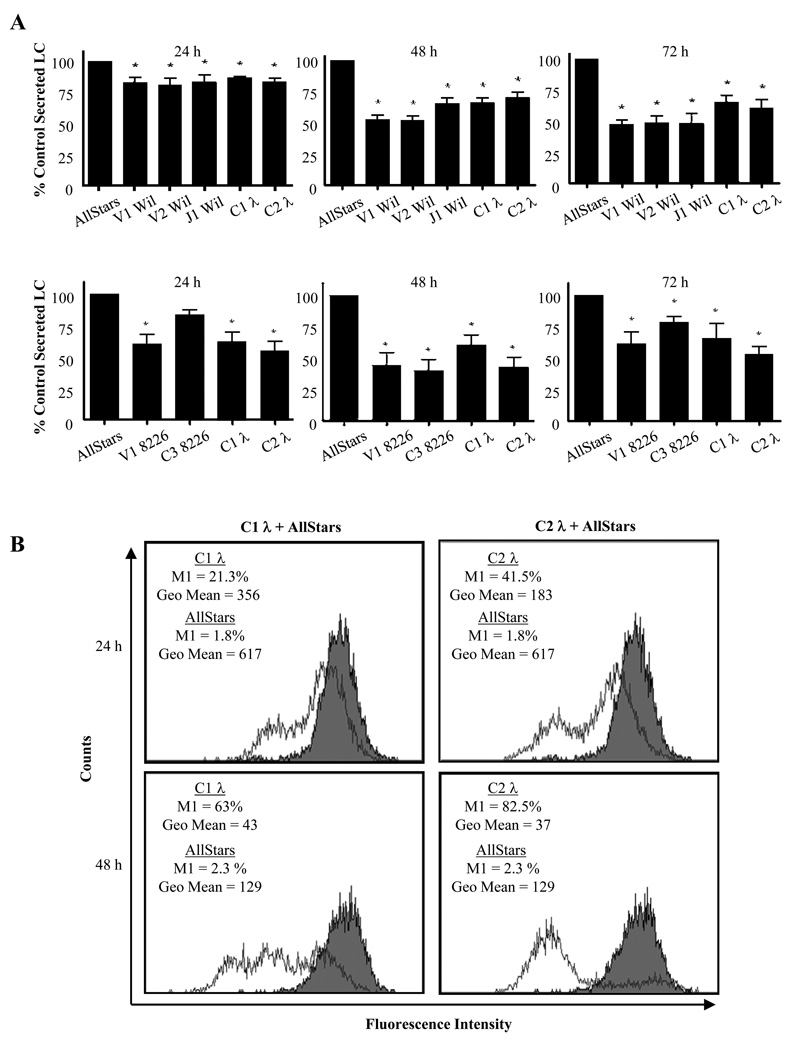
Figure 3.
Effect of siRNA on LC synthesis. (A, upper) SP2/O-λ6 and (lower) 8226 cells were cultured 24, 48, or 72 hours with siRNA oligonucleotides, as indicated. At given time points, the centrifuged supernatants were analyzed by ELISA. The data shown represent the ratio of LC concentrations within supernatants of siRNA-treated cells versus controls. For each group, ratios were averaged and analyzed by one-way ANOVA (n = 6; mean ± SEM; *, p < 0.05). (B) Cλ-specific siRNA induced reduction in plasma cell LC concentration. Flow cytometric analysis of 8226 cells transfected with siRNAs C1 λ, C2 λ (open histograms) or AllStars controls (closed histograms). Regional markers that excluded sham treated cells were set for green fluorescence. For each panel, the geometric mean of the gated cell population and the percent of cells falling within the marker region are indicated.

